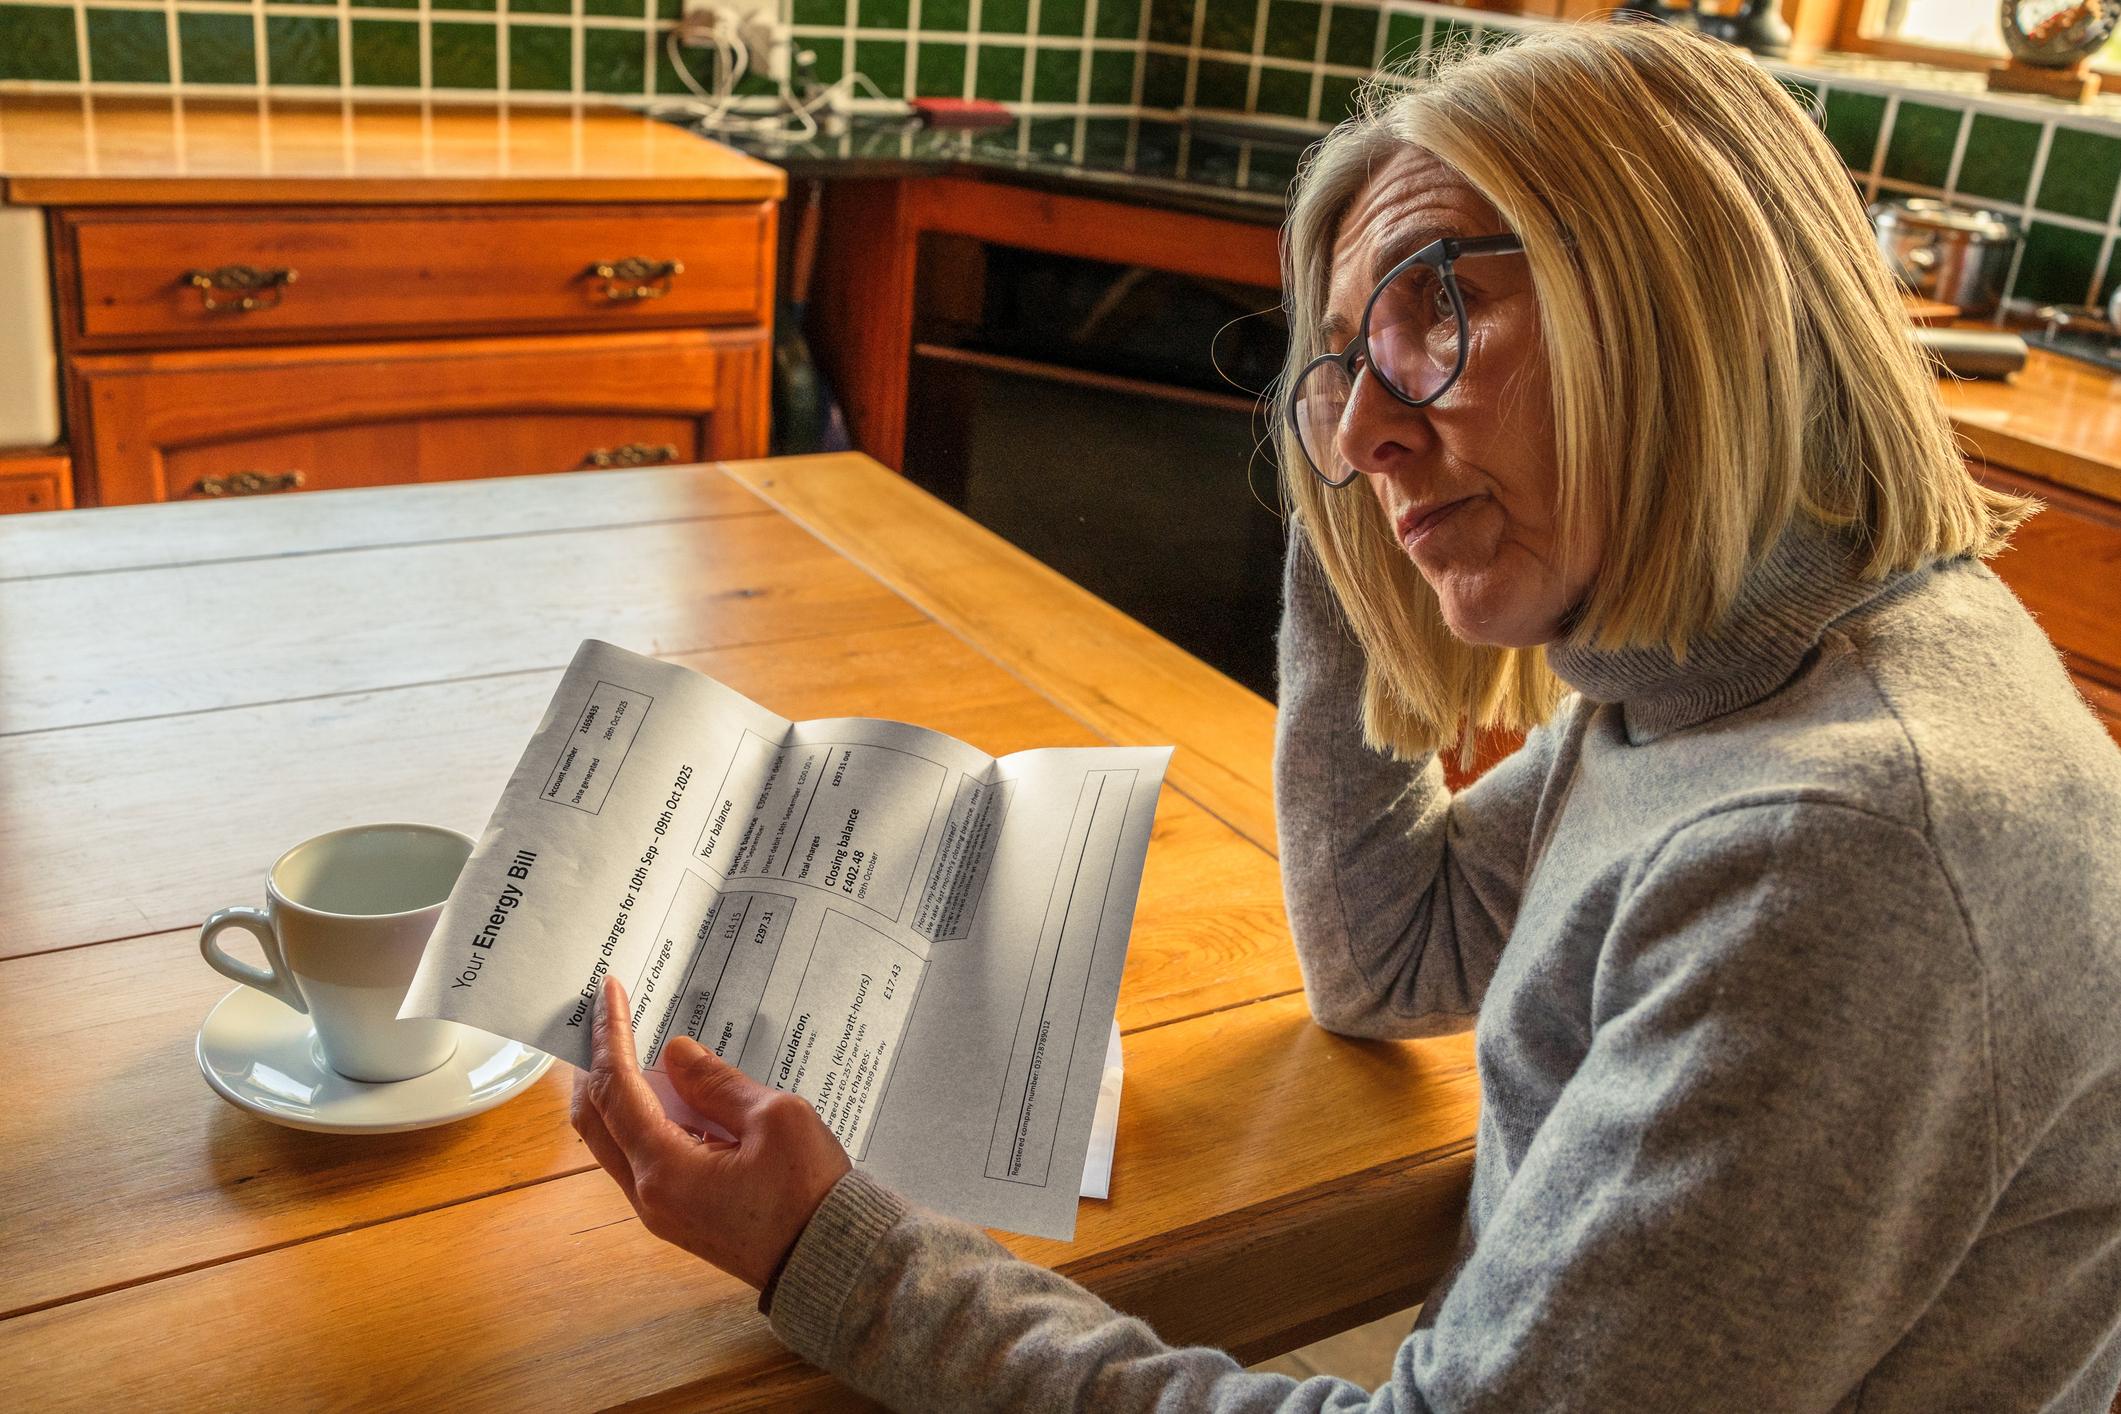
For millions of UK households, the uncomfortable reality is this: the average electricity standing charge is now more than double the actual gas unit price per kWh. British energy billing has evolved into one of those modern systems where simply existing near infrastructure appears to cost almost as much as using it. A triumph of administrative creativity.
As of April to June 2026, the average UK standing charges under the Ofgem price cap are:
- Electricity standing charge: 57.21p per day
- Gas standing charge: 29.09p per day
Meanwhile, the average unit rates are:
- Electricity: 24.67p per kWh
- Gas: 5.74p per kWh
That means many households are paying the equivalent of:
- Around 2.3 kWh of electricity every day before switching anything on
- Over 5 kWh of gas daily before using any heating or hot water
In practical terms, your standing charges alone can now exceed the cost of running several appliances every single day.
What is a standing charge?
The daily fee most households cannot avoid
A standing charge is the fixed daily amount added to your bill regardless of energy usage.
You pay it even if:
- You go on holiday
- Your property is empty
- You aggressively switch off every appliance in a fit of financial despair
- You generate most of your electricity from solar panels
The charge is meant to cover:
- Maintaining the energy network
- Meter maintenance
- Government schemes
- Supplier operating costs
- Legacy industry debt and infrastructure costs
Ofgem says standing charges help fund the UK's energy system and keep homes connected to the grid.

Current Supplier Watch
Why consumers are angry about standing charges
You pay even when you use less
One of the biggest complaints is simple: households trying hardest to cut energy use often save less than expected because standing charges remain fixed.
A low-energy household could turn the heating down, use fewer appliances, reduce shower times and install efficient lighting, and still face hundreds of pounds annually in unavoidable costs.
According to Ofgem figures, average annual standing charges now total roughly:
- Electricity: £209 per year
- Gas: £106 per year
Combined dual-fuel standing charges can exceed £315 annually before any actual energy use. For many pensioners, single occupants and careful households, this has become a major source of frustration.
The real-world cost per kWh equivalent
Standing charges compared to actual energy use
To understand why people are upset, it helps to convert standing charges into "effective usage".
The average electricity standing charge of 57.21p per day equals roughly 2.3 kWh of electricity at current capped rates. The average gas standing charge of 29.09p per day equals around 5 kWh of gas before heating even starts.
| Appliance | Approximate Cost |
|---|---|
| Boiling a kettle | 7p to 10p |
| Running LED lighting all evening | 5p to 15p |
| One washing machine cycle | 20p to 40p |
| Standing charge alone (electricity) | 57.21p daily |
← Swipe to see more →
That means your standing charge can easily cost more than your lighting and appliance usage combined on a quiet day.
Why are standing charges so high?
The UK energy system is expensive to maintain
Several factors have pushed standing charges upwards.
Network infrastructure costs. The UK has ageing gas pipes, substations and transmission systems requiring billions in maintenance and upgrades.
Supplier failures. After dozens of suppliers collapsed during the energy crisis, some recovery costs were effectively spread across customer bills.
Regional distribution costs. Remote areas cost more to serve, especially parts of Scotland, Wales and rural South West England. This is why standing charges vary significantly by region.
Policy costs. Certain environmental and social schemes have historically been recovered through standing charges rather than usage rates.
**Consumers trying to understand whether standing charges could rise further should also read UK Energy Price Forecast (Updated Weekly), which tracks expected changes in wholesale markets, network costs and future household energy bills.

Regional differences can be extreme
Some areas pay much more than others
Regional pricing differences remain one of the least understood aspects of UK energy billing. Examples from recent regional averages include:
- North Wales and Mersey electricity standing charge: over 71p daily
- Northern Scotland: over 62p daily
- London: closer to 47p daily
This means two households with identical usage could pay very different annual totals simply because of where they live. For rural households already dealing with oil heating, poor insulation and limited supplier choice, the effect can feel particularly punitive.
Infrastructure costs and network resilience vary considerably across Britain. Our analysis of Why Are Some Areas More Vulnerable to Power Cuts? explains why some regions face higher network costs and greater electricity reliability challenges than others.
Are low or zero standing charge tariffs coming?
Ofgem is under pressure
Following growing public criticism, Ofgem has pushed major suppliers to trial lower standing charge tariffs during 2026. Large suppliers including British Gas, EDF Energy, E.ON Next and Octopus Energy are expected to offer alternative pricing models.
However, there is an important catch. Most "low standing charge" tariffs simply shift those costs into higher unit rates, peak pricing or time-of-use structures. So heavy energy users may end up paying more overall.
Who suffers most from high standing charges?
Low usage homes often lose out
The households most affected are often pensioners, single occupants, people in small flats, energy-conscious households, solar panel owners and empty property owners.
Someone using very little gas in summer may discover that most of their monthly bill is standing charge rather than actual energy use.
| Monthly Summer Gas Bill | Approximate Amount |
|---|---|
| Actual gas used | £4 to £8 |
| Standing charges | £9 to £12 |
| Total bill | £15 to £20 |
← Swipe to see more →
This is one reason many consumers feel disconnected from the idea that "using less saves money". Because sometimes, frankly, it barely does.

Can you reduce standing charges?
Your options are limited
Unlike unit usage, standing charges are difficult to eliminate entirely. Possible ways to reduce the impact include:
- Switching tariffs. Some fixed tariffs may offer slightly lower standing charges.
- Considering no standing charge tariffs. These are becoming more available in 2026, though unit prices are usually higher.
- Disconnecting gas. Some households moving fully electric are permanently removing gas connections to avoid gas standing charges entirely.
- Solar and battery systems. These help reduce unit consumption but usually do not remove standing charges unless properties disconnect from the grid altogether.
The bigger debate facing the UK
Should households pay simply to stay connected?
Critics argue standing charges unfairly punish lower income households, efficient users and vulnerable people trying to cut costs. Supporters argue the grid itself must still be funded regardless of usage.
The reality is the UK energy market increasingly resembles a hybrid system where unit prices fund consumption and standing charges fund infrastructure survival.
The problem is that many consumers only notice this once their bill arrives and half of it appears to be charged for the privilege of owning a meter attached to the wall. A very British experience. Quietly expensive and explained in a PDF nobody reads.
Recommended kit

Door Bottom Draught Excluder
Block cold draughts under exterior doors — one of the cheapest wins for cutting winter heating loss.
Shop on AmazonWhat is the average UK standing charge in 2026?
Under the April to June 2026 Ofgem price cap, the average electricity standing charge is around 57.21p per day and the average gas standing charge is around 29.09p per day. Combined, that is roughly £315 a year before you use any energy at all.
Why do I pay a standing charge even when I use no energy?
The standing charge is a fixed daily fee that funds the energy network, meter maintenance, government schemes, supplier operating costs and legacy industry debt. Because it covers keeping your home connected to the grid rather than your actual usage, it applies even when your property is empty.
Why are standing charges different depending on where I live?
Standing charges are partly set by regional distribution network costs. Areas that are more expensive to serve, such as North Wales, Mersey and Northern Scotland, tend to have higher daily charges, while London is typically lower. Two identical households can pay very different totals based purely on location.
Are no standing charge tariffs actually cheaper?
Not always. Most low or zero standing charge tariffs recover the same costs through higher unit rates or time-of-use pricing. They can suit very low-usage homes, but heavy energy users often end up paying more overall, so it pays to compare your annual cost rather than just the daily fee.
Can I avoid the gas standing charge?
The only way to fully remove the gas standing charge is to disconnect the gas supply entirely, which some households do when going fully electric. Otherwise the daily gas charge applies even in summer when you use little or no gas.